Break Even Analysis: How to Calculate and Use It
- Sparkz Business

- Jun 5
- 8 min read
You started a business to make money. But do you know how much you need to sell just to cover your costs?
That is what a break even analysis tells you. It shows you the exact point where your revenue matches your expenses. No profit. No loss. Just zero.
Once you know that number, you can plan smarter. You can set better prices, cut unnecessary costs, and know when to expect your first real profit.
In this guide, we will walk you through everything you need to know. We will explain the break even point formula, show you how to calculate break even point step by step, and give you real examples along the way.
What Is Break Even Analysis?
Break even analysis is a simple financial tool. It tells you how much you need to sell to cover all your costs.
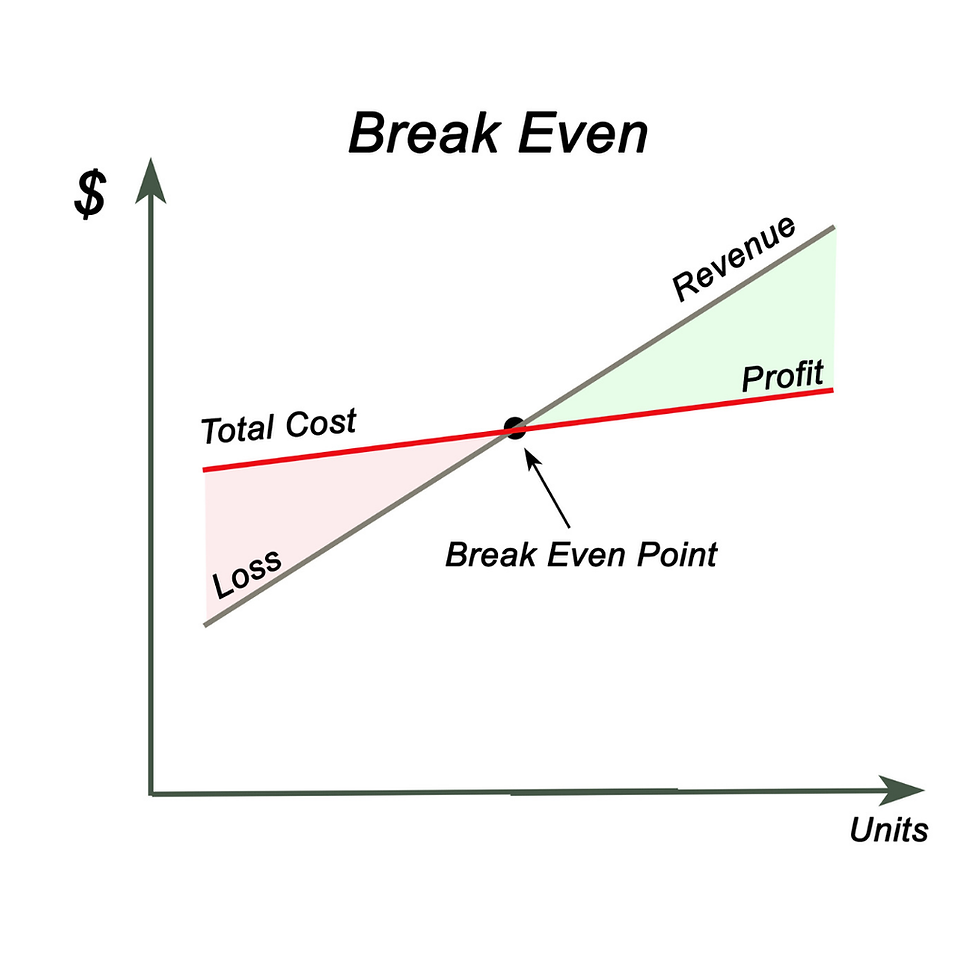
When your total revenue equals your total costs, you have reached the break even point. At that moment, you are not losing money. But you are not making money yet either.
Every dollar you earn after that point is profit.
This kind of business cost analysis is used by new startups, small business owners, and large companies alike. It is one of the first steps in any solid startup financial planning process.
Think of it this way. Imagine you sell handmade candles. Before you sell a single candle, you spend money on supplies, tools, and packaging.
That is your cost. Break even analysis tells you how many candles you need to sell before you stop losing money.
Why Does It Matter for Your Business?
A break even calculation does more than just give you a number. It helps you make better decisions in several key areas. In fact, it is one of the most useful tools you can add to your business model from day one.
1. Pricing Strategy for Your Business
Setting the right price is one of the hardest things about running a business. Price too high and you lose customers. Price too low and you lose money.
A break even study shows you the minimum price you need to charge to cover your costs. From there, you can decide how much profit margin to add. This makes your business pricing model much easier to build.
2. Understanding Revenue vs Profit
A lot of new business owners confuse revenue and profit. Revenue is all the money coming in. Profit is what is left after you pay your costs.
Many businesses have strong revenue but low or even negative profit. Break even analysis helps you see the difference clearly. It shows you if your revenue vs profit gap is too wide to sustain.
3. Building Financial Projections
Investors and lenders want to see financial projections before they hand over money. A break even analysis is often the first thing they look at. It shows that you understand your numbers and have a realistic plan.
4. Spotting Trouble Early
If your break even point is very high, that is a warning sign. It might mean your costs are too high or your prices are too low. Catching this early can save your business from serious problems later.
The Key Parts of Break Even Analysis
Before you can run the numbers, you need to understand three main concepts. These are the building blocks of any cost breakdown.
Fixed Costs
Fixed costs stay the same no matter how much you sell. These are expenses you have even if you sell nothing.
Examples of fixed costs include rent, insurance, software subscriptions, and salaries. Labor costs such as staff wages and contractor fees also fall into this category if they stay consistent each month.
In a fixed and variable costs breakdown, these are the expenses that do not change with your sales volume.
Variable Costs
Variable costs change based on how much you produce or sell. The more you sell, the higher your variable costs.
Examples include raw materials, packaging, and shipping costs. Fixed and variable costs together make up your total cost structure.
Selling Price Per Unit
This is how much you charge a customer for one product or service. This number plays a huge role in your break even calculation.
The Break Even Point Formula
Now let us get into the actual math. Do not worry. It is simpler than it looks.
Here is the break even point formula:
Break Even Point = Fixed Costs / (Selling Price - Variable Cost Per Unit)
The bottom part of that formula, Selling Price minus Variable Cost Per Unit, is called the contribution margin. Let us look at the contribution margin formula on its own:
Contribution Margin = Selling Price Per Unit - Variable Cost Per Unit
The contribution margin tells you how much each sale contributes toward covering your fixed costs. Once your total contributions cover all fixed costs, you break even.
Quick Tip:
A higher contribution margin means you break even faster. If your contribution margin is low, you need to sell a lot more units just to cover your fixed costs.
How to Calculate Break Even Point: A Step-by-Step Example
Let us use a real cost structure example to make this concrete.
The Business: You sell custom phone cases online.
Fixed costs per month: $2,000 (rent for a small workspace, software, and your website)
Variable cost per case: $8 (materials and packaging)
Selling price per case: $28
Step 1: Calculate the Contribution Margin
Contribution Margin = $28 - $8 = $20 per unit
Each phone case you sell contributes $20 toward your fixed costs.
Step 2: Calculate the Break Even Point
Break Even Point = $2,000 / $20 = 100 units
You need to sell 100 phone cases per month to break even.
That means your 101st sale starts generating actual profit. Every case sold after that puts money in your pocket.
What This Tells You:
If you are currently selling 60 cases per month, you know you are losing money. You need to either sell 40 more cases, lower your variable costs, raise your price, or reduce your fixed costs.
How to Calculate Break Even in Dollar Revenue
Sometimes you do not sell one type of product. You sell many. If you offer a full product line or a mix of services, you want to know your break even revenue in dollars, not in units.
Use this version of the formula:
Break Even Revenue = Fixed Costs / Contribution Margin Ratio
Contribution Margin Ratio = Contribution Margin / Selling Price
Using our phone case example:
• Contribution Margin Ratio = $20 / $28 = 0.71 (or 71%)
• Break Even Revenue = $2,000 / 0.71 = $2,817 per month
You need to bring in about $2,817 in monthly revenue to break even. Anything above that is profit.
How to Use Break Even Analysis to Set Your Prices

Now you know the math. But how do you use it in real life?
Here is a simple way to think about it. Start with your desired profit. Then work backward.
Let us say you want to make $1,000 profit per month on top of your break even point.
Target Sales = (Fixed Costs + Desired Profit) / Contribution Margin
Target Sales = ($2,000 + $1,000) / $20 = 150 units
You need to sell 150 phone cases to hit your goal. If that seems too high, you have three options:
• Increase your selling price to boost your contribution margin
• Lower your variable costs by finding cheaper suppliers
• Reduce your fixed costs by cutting unnecessary expenses
This is how break even analysis connects directly to your pricing strategy for your business. It gives you a solid foundation for your business pricing model instead of guessing.
Profit Margin Formula: What Comes After Break Even
Once you are past the break even point, you are in profit territory. The profit margin formula tells you how much of each sale you actually keep.
Profit Margin = (Revenue - Total Costs) / Revenue x 100
For example, if you sell 150 cases in a month:
• Revenue: 150 x $28 = $4,200
• Total Costs: $2,000 + (150 x $8) = $3,200
• Profit: $4,200 - $3,200 = $1,000
• Profit Margin: $1,000 / $4,200 x 100 = 23.8%
That means you keep about 24 cents from every dollar you earn.
Tracking this number alongside your break even point gives you a full picture of your financial health.
Common Mistakes to Avoid
Even with the right formulas, many business owners make avoidable mistakes. Here are the most common ones.
Forgetting Hidden Fixed Costs
Many people forget to include things like their own time, bank fees, or annual subscriptions. These are still fixed costs even if they are easy to overlook.
Using the Wrong Variable Costs
Make sure you include every cost tied to each sale. That includes merchant fees, returns, and delivery costs. Missing even one of these can throw off your whole cost structure.
Never Updating the Analysis
Your costs change over time. Prices go up. You hire staff. You move to a bigger space. Run a new break even calculation every few months to stay on track.
Treating Break Even as a Goal
Breaking even just means you are not losing money. It is a short term milestone, not a finish line. Your real goal should always be growing your profit margin over time.
A Real-World Cost Structure Example for a Service Business
Not every business sells physical products. Let us look at a service business to show how the same ideas apply.
The Business: A freelance social media manager.
Fixed costs per month: $500 (software tools, accounting app, home office)
Variable cost per client: $50 (extra tools, research time per client)
Price per client per month: $300
Contribution Margin = $300 - $50 = $250 per client
Break Even Point = $500 / $250 = 2 clients
You only need 2 clients to break even. The third client and every one after that is pure profit. That is a very strong contribution margin, which is why service businesses often have high profit potential.
It also shows how your business model directly shapes how quickly you can reach profitability.
How Break Even Fits Into Startup Financial Planning
If you are just starting out, a break even analysis is one of the most important things you can do.
Here is how it fits into your bigger financial plan.
Use it to set your launch price before you open your doors
Include it in your business plan to show investors you know your numbers
Use it to decide how much funding you actually need
Revisit it every quarter as part of your financial projections
Banks and investors often ask for break even data before approving loans or investments. Having this ready shows that your startup financial planning is solid and serious.
It also proves that you have a clear handle on your day-to-day business operations and what it costs to keep them running.
Key Takeaways
Here are the key takeaways from everything we covered in this post:
Break even analysis tells you how much you need to sell to cover all costs
The break even point formula is: Fixed Costs divided by Contribution Margin per Unit
The contribution margin formula is: Selling Price minus Variable Cost Per Unit
Fixed costs stay the same. Variable costs change with sales volume.
Knowing your break even point helps you set prices, plan finances, and attract investors
Update your analysis regularly as your cost structure changes
Ready to Take Control of Your Business Finances?
Now that you understand break even analysis, the next step is putting it to work. At Sparkz Business, we help entrepreneurs and small business owners build clear, confident financial plans from the ground up.
Whether you need help setting up your cost structure, building your first financial projections, or creating a pricing strategy that actually works, our team is here to help.


Comments